Primary & Auxiliary Public Goods
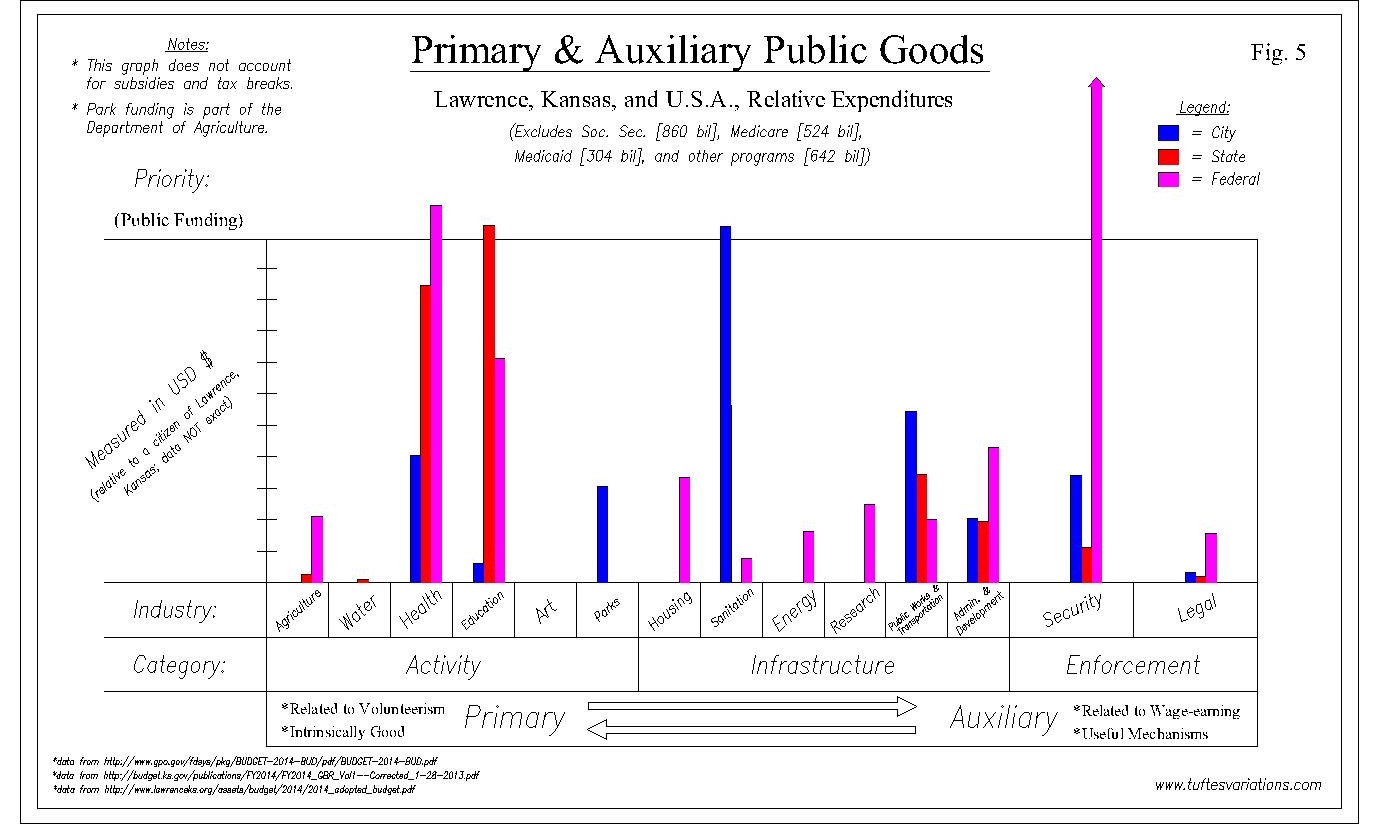
This is a series of graphs that shows 2014 public funding along city, state, and national levels. Figure 1 explains the concept behind “primary/auxiliary” and other features of the graphs. Figure 2 shows the City of Lawrence’s public funding. Figure 3 shows public funding of the State of Kansas. Figure 4 shows discretionary National funding. And finally, Figure 5 (pictured) shows relative priority between the three levels. At the very least, these graphs illustrate a mysterious world that is often buried within budgets hundreds of pages long. At most, and intentionally so, they will hopefully provide an “applied philosophy”, in the form of a simple spectrum by which we may generally follow. Exceptions exist, of course, and I encourage readers to find them. Observe: